Context
Olist is a real Brazilian e-commerce marketplace. Every delivered order carries both an estimated delivery date and the actual delivery date, plus a post-purchase review score, a combination that makes it possible to ask a genuine operations question with real data instead of a synthetic one: when a delivery misses its promised date, does it actually move customer satisfaction, or is the intuition overstated?
Business Problem
Does missing the estimated delivery date measurably hurt customer satisfaction on the Olist marketplace, enough to justify investing in tighter delivery-date estimation or logistics prioritization for the slowest regions?
Architecture
The derived table is built once by SQL/pandas joins across orders, customers, order items, sellers, products and the geolocation table, then everything downstream (the notebook, the figures, the README) reads only from that table and from the JSON evidence file it produces. No number in this write-up was hand-typed from a console summary.
Data Source
- Source: the Olist Brazilian E-Commerce Public Dataset (Kaggle). Kaggle requires an authenticated login for bulk download, unavailable in the build environment, so the 9 raw CSVs were pulled from a verified, byte-identical mirror on Hugging Face.
- Population: 95,824 delivered orders with a valid estimated date, a valid actual delivery date, and a matched review (99.5% geolocation coverage for the distance calculation).
- Key variables:
on_timevs.late,satisfied(review score ≥ 4), customer/seller region, seller↔customer Haversine distance, product category.
Known limitations, stated up front: for orders with multiple sellers, the first line item's seller is used for the distance calculation, a simplification. And critically: late-vs-on-time is not randomly assigned, which shapes the entire methodology below.
Methodology
Framework: CRISP-DM, applied to an observational quasi-experiment, explicitly not a randomized A/B test. Whether an order arrives late correlates with distance, carrier, product category and season, so every result is stated with that limitation attached, and the analysis includes a dedicated step to check whether the effect survives the single most obvious confound.
- Business & data understanding: define the outcome metric (
satisfied) and the two groups being compared. - Data preparation: join 9 tables in SQLite; derive on-time flag, satisfaction flag, region and distance; run 8 fail-loud quality gates before trusting anything downstream.
- Descriptive analysis: satisfaction rate per group with a Wilson 95% confidence interval.
- Hypothesis test: H0: equal satisfaction rates; H1: they differ. Two-proportion Z-test, cross-checked with a chi-square test of independence.
- Confidence interval and effect size: the difference in proportions plus Cohen's h, not just a binary "significant / not significant."
- Power analysis: achieved power at the observed effect, and the minimum effect size that would have been detectable at 80% power.
- Segmentation: by region, with an explicit multiple-comparisons caveat.
- Confound control: the comparison is re-run within delivery-distance quartiles to test whether it survives the most obvious alternative explanation.
AI-assisted communication (AI assists, human validates)
Once every statistic is computed and validated against the JSON evidence file, an LLM drafts the plain-language translation for a non-technical audience. The human owns and validates every number before publication; the AI's role is limited to phrasing already-validated figures.
Challenges
1. A real dataset doesn't hand you a randomized experiment
The original plan pointed at a synthetic Kaggle "A/B testing" dataset, clean, pre-randomized, built for exactly this toolkit. The user asked for something real and large instead, which meant giving up the one convenient fiction: a control group that was actually assigned at random. Olist's on-time/late split is observational. Rather than borrow RCT language it hadn't earned, the whole write-up says "quasi-experiment" everywhere a result appears, and the analysis adds a step a true randomized test wouldn't need: checking whether the effect survives when delivery distance is held roughly constant.
2. Kaggle needs a login the build environment doesn't have
Bulk-downloading the dataset via Kaggle's API requires an authenticated token, and none was configured in this environment. The fix was to find and verify a byte-identical mirror (Hugging Face) that serves the same 9 raw files, including the geolocation table most mirrors quietly drop, confirmed by checking known row counts (3,095 sellers, 99,441 orders) against the canonical dataset before trusting it for the real analysis.
3. "p = 0.0" is a rounding artifact, not a finding
At n = 95,824 and an effect this large, both the Z-test and the chi-square cross-check return a p-value below float64's smallest representable positive number: Python stores that as exactly 0.0. Reporting "p = 0" would assert an impossible certainty; the honest statement, used throughout, is "p < 0.001."
4. Ruling out the obvious confound
Distance is the first thing anyone would suspect explains a late-delivery penalty: maybe far-away customers are just harder to satisfy for reasons that have nothing to do with lateness. Stratifying the comparison into delivery-distance quartiles rules that out on its own: the satisfaction gap holds in every quartile (34.9pp at the closest, 51.9pp at the farthest), which is evidence the effect isn't simply "distance in disguise," even though it still isn't proof of causation.
Results
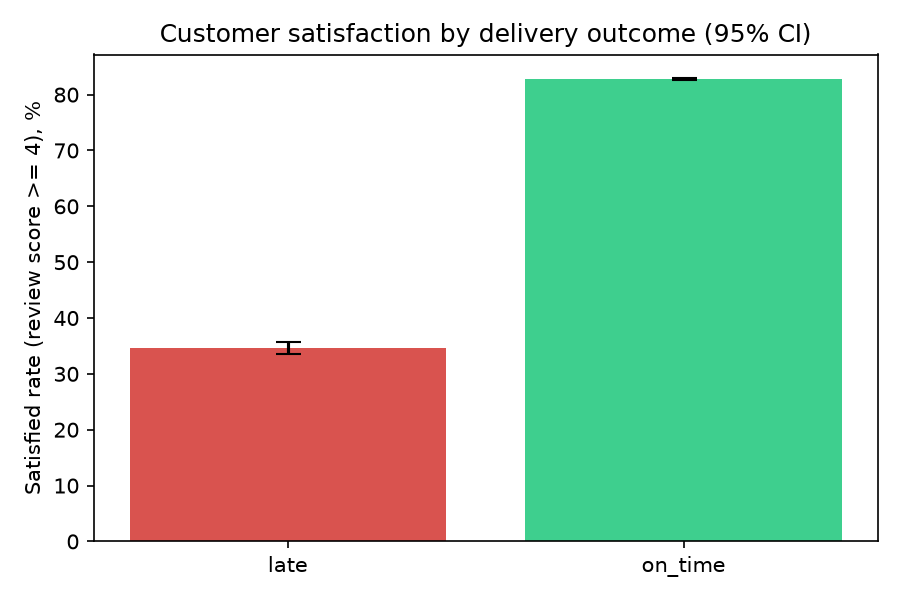
Orders delivered late have a satisfaction rate of 34.56%, versus 82.79% for on-time orders: a 48.22 percentage-point gap (95% CI [47.13, 49.32] pp, p < 0.001, chi-square cross-check p < 0.001; effect size Cohen's h = 1.03, conventionally "large"). At n = 7,661 per group, achieved power is 1.0, and the minimum detectable effect at 80% power (h = 0.045) is far smaller than what was observed, so this isn't a huge sample manufacturing significance out of a trivial effect.
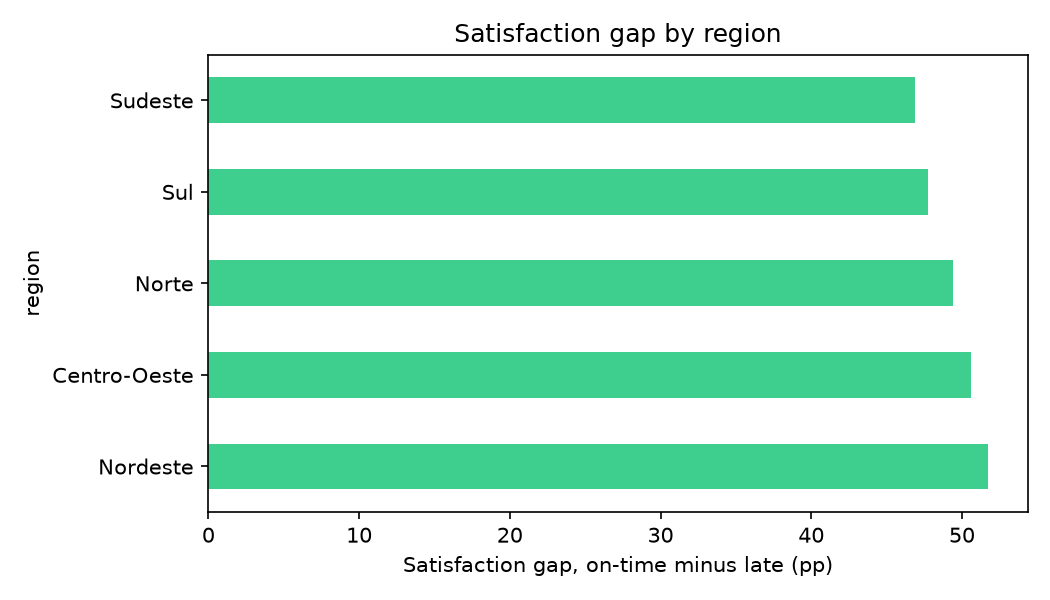
- The gap holds in every region: 46.90pp in Sudeste to 51.76pp in Nordeste, the widest.
- The gap holds in every delivery-distance quartile: 34.87pp closest to 51.90pp farthest.
- Caveat, repeated deliberately: this remains an observational comparison. Carrier, product category and season are plausible confounds not controlled for here.
Recommendation
Late deliveries are strongly associated with a roughly 48-point drop in customer satisfaction, and the effect holds even after accounting for delivery distance. Ship the investment: prioritize tightening delivery-date estimates and logistics reliability, starting with Nordeste (the widest regional gap), and re-measure after the change. This is strong evidence to act on, not proof of a causal fix without a follow-up controlled test.
Tech Stack
| Category | Tool |
|---|---|
| Language | Python 3.11 |
| Statistics | scipy.stats, statsmodels |
| Data handling | pandas, numpy |
| Storage | SQLite |
| Visualization | matplotlib |
| Notebook | Jupyter (programmatically generated and executed via nbformat/nbconvert) |
| Testing | pytest, 12 unit tests for the geo/stats utilities |
| AI assist | LLM (plain-language translation of validated results) |