Context
This project is a from-scratch build of the One Billion Row Challenge in Python: generate a billion station;temperature records, then compute min/mean/max per station as fast as possible. It predates this portfolio (first built and published independently) and was brought in here, renamed to the portfolio's ID convention, and re-run end to end on new hardware to produce fresh, artifact-sourced evidence instead of just carrying over the original numbers.
Business Problem
Given a workload too large to comfortably fit in memory, which processing engine actually handles it, and what does "handles it" cost in time versus memory? The answer isn't universal: it depends on whether an engine's execution model is genuinely out-of-core or only claims to be.
Architecture
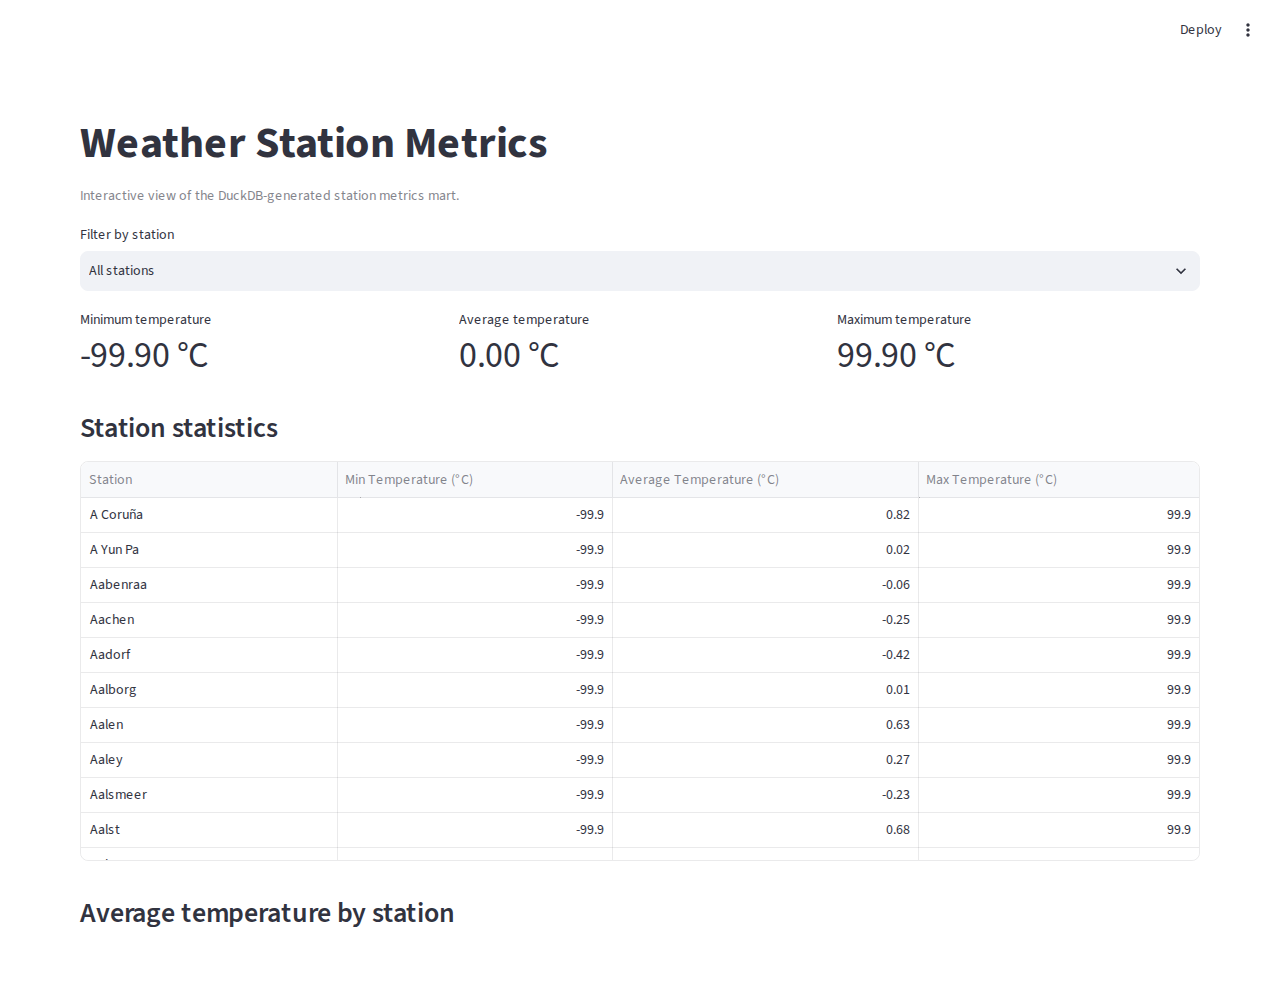
One generator (create_measurements.py) produces a single input file. Eight independent implementations read the same file and write the same output schema (station;min;mean;max), so approaches are comparable without changing the contract on either end. A Streamlit dashboard reads whichever run's output landed in data/station_metrics_mart.csv.
Reproduced in this portfolio session (2026-07-18)
Re-run on 20 CPUs / 15 GiB RAM / 4 GiB swap, deliberately different hardware from the original benchmark, to test whether the conclusion holds rather than just repeat it. Full 1,000,000,000-row input (14.8 GiB, generated in 324 s). Scope was narrowed to the three fast implementations; the slow stdlib/pandas paths already have historical numbers (12-24 min each) that re-running wouldn't change the conclusion of.
| Implementation | Result | Source |
|---|---|---|
| DuckDB | ✅ 22.73 s, 41,343 stations | logs/log_duckdb.csv |
| PyArrow | ✅ 1,185.02 s (~19.75 min), 41,343 stations | logs/log_pyarrow.csv |
| Polars (lazy) | ❌ OOM-killed at 12.51 GiB resident | journalctl -k (kernel OOM-killer log) |
Full machine-readable results: docs/evidence/run_results.json in the repo.
Results
Challenges
1. A killed process still has to reach a real explanation
The driver script used set -e, so the Polars OOM kill (exit 137) stopped the batch before the dashboard-mart step ran. Rather than treat that as a script bug to route around silently, the kernel's own OOM log (journalctl -k) was pulled for the exact resident-memory figure at time of kill, and the mart was rebuilt manually from DuckDB's output, the implementation that actually finished.
2. Historical numbers vs. reproduced numbers
The original README's benchmark table was collected on different hardware (Intel i5-14500T, 16 GiB RAM). Rather than overwrite it with this session's numbers, which would quietly erase the original evidence, both live in the README: the new run first, clearly dated and scoped, the historical table preserved below it and labeled as such.
Tech Stack
| Category | Tool |
|---|---|
| Engines compared | stdlib Python, pandas, PyArrow, Polars, DuckDB |
| Dashboard | Streamlit + Plotly |
| Testing | pytest (tiny fixtures, never the 1B-row file) |
| Tooling | Ruff, Black, pre-commit, pip-audit |